On this page: Charts
You can add a chartby clicking the right button of the mouse on the section where you want to add the chart and choose "add a chart" in the contextual menu.
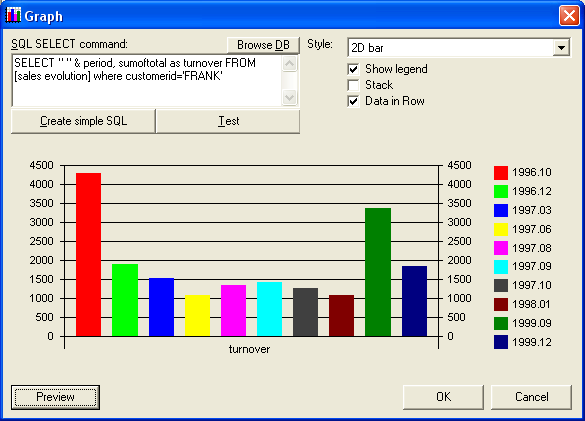
If you double click on the "chart control" you will see the chart properties window.
In the "SQL SELECT command" field, enter the query that will create the data needed to plot the chart. You can enter parameters like {[Section name].[field name]} to make references to query results of previous (or current) sections. (note: When you click on the preview these references cannot be evaluated. To make a preview replace these references for a real value).